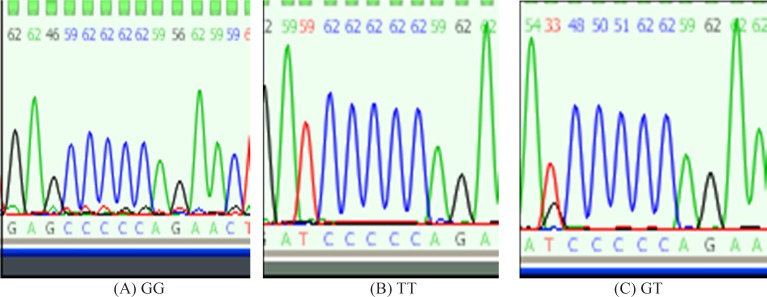
Figure 1.
Patients’ genotype determination by use of Sanger sequencing by considering location of the SNP in NOS3: (A) Single black peak indicate homozygote in the form of GG genotype. (B) Single red peak indicate homozygote in the form of TT genotype. (C) Double peak (red and black) indicate heterozygote in the form of GT genotype

