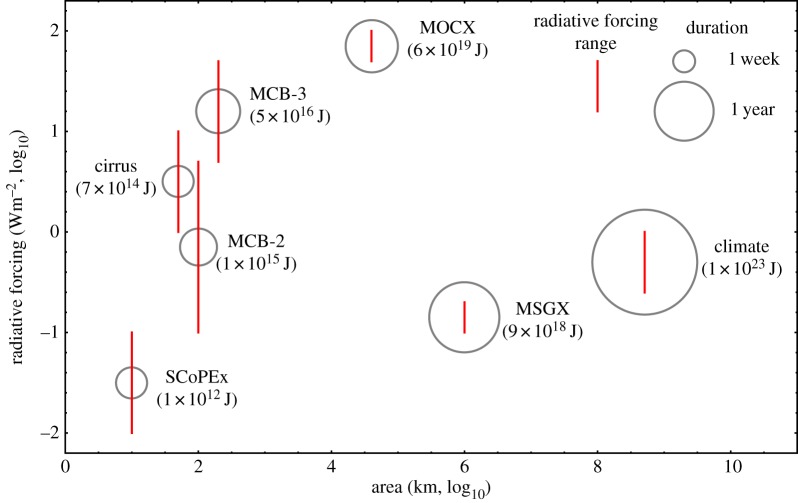
Figure 3.
Comparison of the climate forcing of field experiments. Area and local radiative forcing (ΔRF) are plotted as red bars on the axes of a log–log plot, where the bars indicate the range of possible ΔRF from table 3. Duration is indicated by the size of the grey circles as show in the key (the area of the circles is proportional to the square root of the duration). A useful measure of the total climate forcing is the product area×duration×ΔRF which has units of energy; this value is given under the experiment name (using average of the maximum and minimum ΔRF). The aggregate forcing energies span 11 orders of magnitude. Finally, note that the cirrus, MCB-3 and MCB-2 all have an area of 100 km2, but the x-axis values have been offset in the figure to show the three red range bars.

