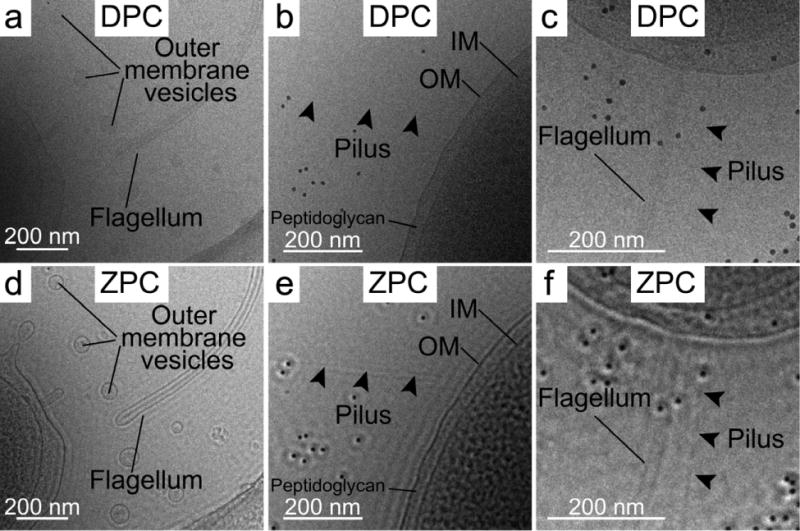
Figure 2.

Enlarged views of DPC and ZPC cryo-EM images of V. vulnificus cells (whole cell images, Supplementary Figure 1). Single low dose (~1.5 e−/Å2) DPC (a, b, and c) and ZPC (d, e, and f) images of portions of individual V. vulnificus cells. Each image set highlights the improvement in image contrast and visibility of the flagellum, outer membrane vesicles, and pilus that was obtained with ZPC (d, e, and f) versus DPC (a, b, and c). Scale bars, 200 nm.
