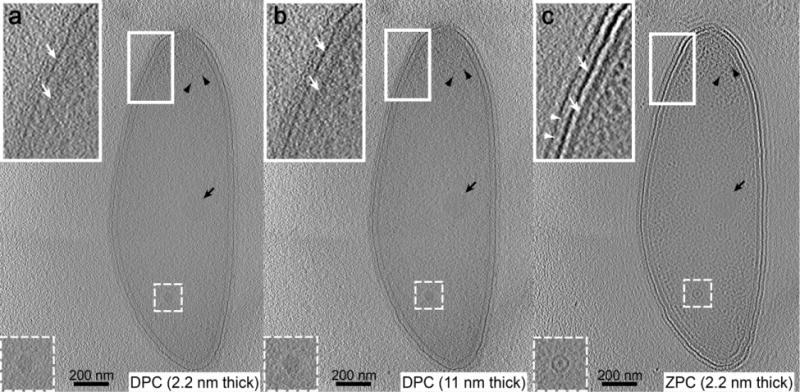
Figure 5.

Cryo-electron tomograms of the same C. crescentus cells. Tomographic slices through the same C. crescentus cell. Single 2.2 nm DPC slice (a), averaged 11 nm DPC slice (b), single 2.2 nm ZPC slice (c). Insets are magnified views of the boxed region (bacterial envelope) highlighting the outer and inner membranes (white arrows) and s-layer periodicity (white arrowhead). Other complexes are noted including, a macromolecular complex (dashed-boxed region), storage granule (black arrow), and ribosomes (black arrowheads). Scale bars, 200 nm.
