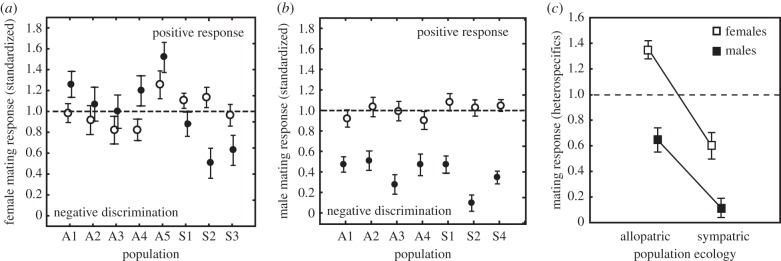
Figure 3.

Population divergence in mate preferences towards con- and heterospecific mates in allopatric (A1–A4) and sympatric populations (S1–S4). Line at ‘1.0’ shows the standardized average response towards conspecific mates. Open symbols shows mean (±95% CIs) response towards conspecifics, and closed symbols mean response (±95% CIs) towards heterospecifics. (a) Female population divergence (two-way ANOVA: population (P): F7,395 = 35.475, p < 0.001; species (S): F1,395 = 4.217, p = 0.04; P × S: F7,395 = 24.828, p < 0.001). (b) Male population divergence (two-way ANOVA: population (P): F6,205 = 8.741, p < 0.001; species (S): F1,205 = 853.357, p < 0.001; P × S: F6,205 = 9.852, p < 0.001). (c) Elevated population divergence in female and male mate preferences towards heterospecifics in allopatric versus sympatric populations (nested mixed model analysis: sex × population ecology: F1,226 = 13.640; p = 0.003; electronic supplementary material, table S2: Model 2).
