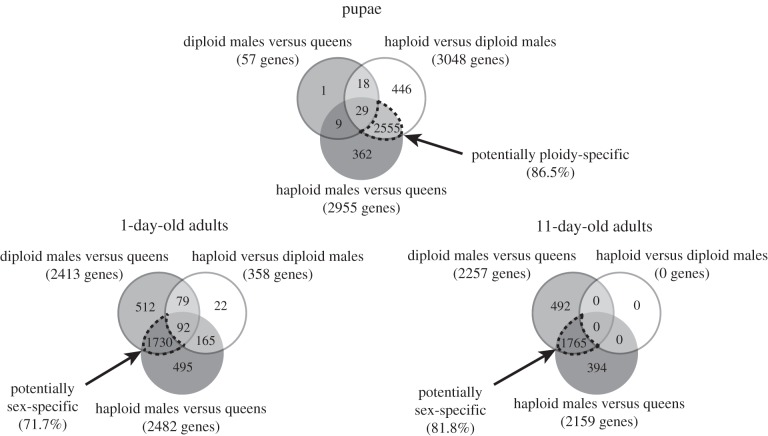
Figure 2.
Venn diagram with the number of genes differentially expressed between S. invicta individuals of three categories at three developmental timepoints. Dash-outlined intersection areas show the numbers of genes that may be ploidy-specific or sex-specific in their expression and the percentages of total genes on the array that they represent.

