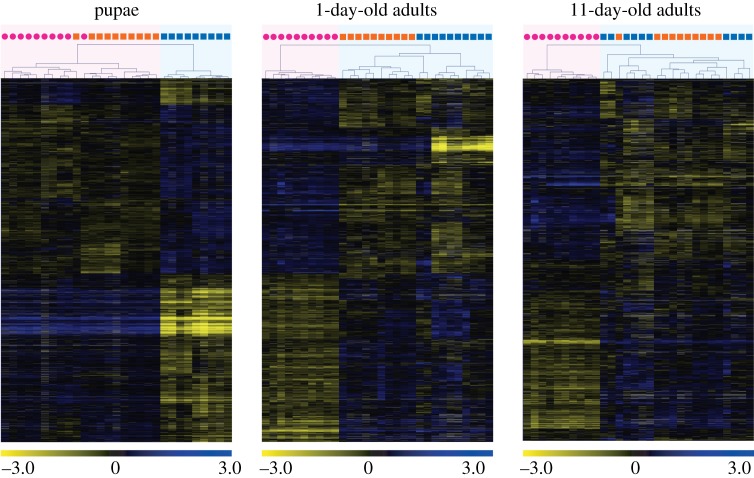
Figure 3.
Results of hierarchical clustering analysis of gene expression profiles at three developmental timepoints in S. invicta. Individual queens (pink circles), diploid males (orange squares), and haploid males (blue squares) are clustered on the basis of similarity of their profiles (expression values were compared to a common reference) at each timepoint. Each row in the heat map represents a gene and each column represents an individual sample. Colours in the heat maps represent relative levels of expression: blue, highly expressed; yellow, lowly expressed; grey, NA (data not available). Numbers are log2-transformed relative expression levels. Note: gene sets differ across the timepoints (see figure 1).

