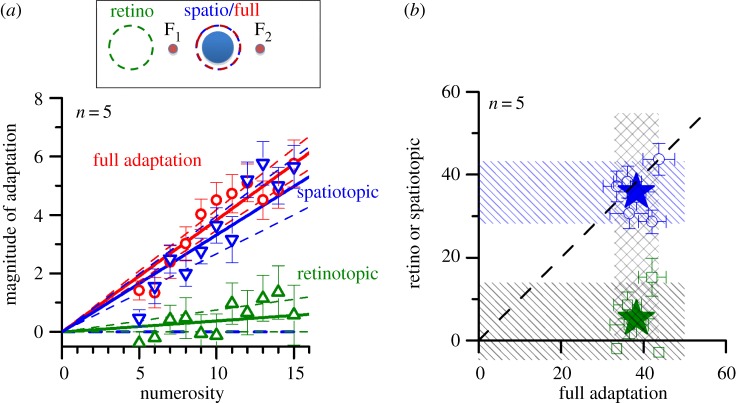
Figure 3.
Spatiotopic and retinotopic adaptation. (a) Adaptation magnitude measured after a 12° saccade (from F1 to F2—see inset) between adaptation and test, with the adaptor in the same spatiotopic (blue symbols) or retinotopic (green symbols) position, or both (red symbols). The spatiotopic adaptation was as strong as full adaptation (no saccade), while retinotopic adaptation caused little effect. (b) Individual AIs after adaptation in the same retinotopic (green symbols) or spatiotopic (blue) positions, plotted against AIs for the ‘full adaptation’ condition (no saccade between adaptor and test). The dashed lines indicate 95% confidence intervals for all conditions.

