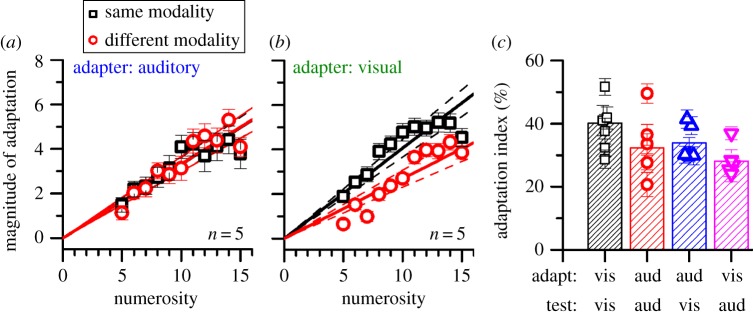
Figure 4.

Auditory and cross-modal adaptation. (a) Adaptation magnitude after adapting to auditory adaptors and testing with auditory stimuli (black symbols) and visual stimuli (red symbols). (b) Adaptation magnitude after adapting to visual adaptors and testing with auditory stimuli (red symbols) and visual stimuli (black symbols). (c) Bar graphs summarizing individual AIs (symbols) and pooled data (bars) for all conditions. vis, visual; aud, auditory.
