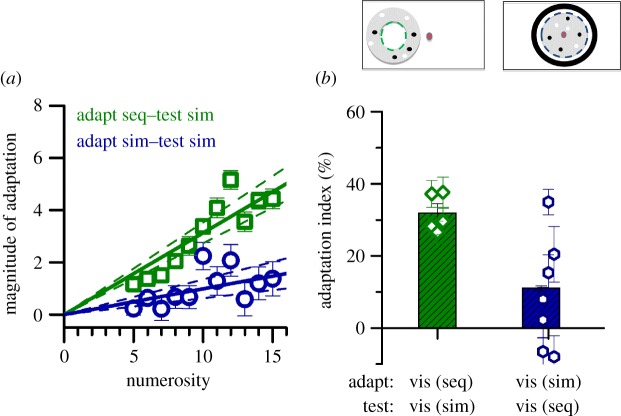
Figure 5.
Cross-format adaptation. (a) Adaptation magnitude after adapting with peripherally displayed sequential flashes and testing with peripherally displayed spatial arrays of dots (green symbols), or adapting to centrally displayed dot arrays and testing with peripheral flashes (blue symbols). The effect of sequential (seq) on simultaneous (sim) is clear (AI = 0.31), but the inverse was not (AI = 0.10), although both are highly statistically significant (p = 0.001). (b) Individual AIs (symbols) and pooled data (bars). vis, visual.

