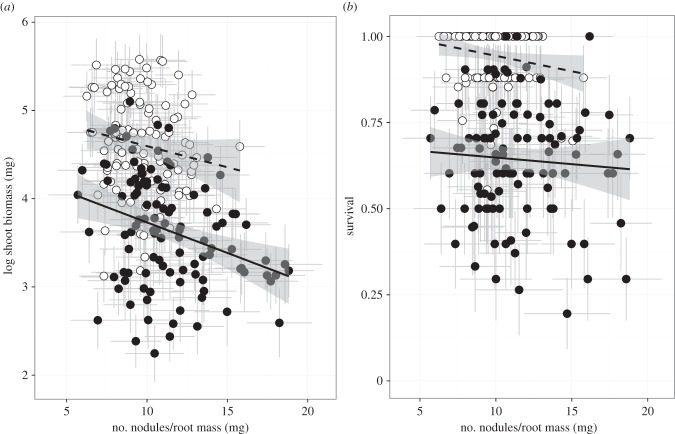
Figure 3.
Genotypic relationship between nodule density and (a) shoot biomass and (b) mortality in the mutualist (dashed line, open circles) and mixed treatment (solid line, closed circles). Each dot is a line mean (n = 110 plant lines/treatment). Grey error bars are ±1 standard error and the 95% CI of the fitted line is shaded in grey.

