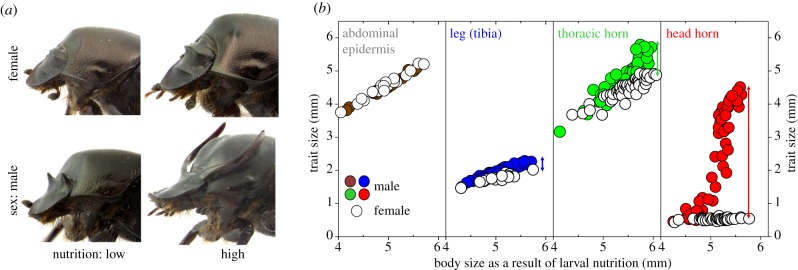
Figure 1.

The effect of nutrition on growth in male and female O. taurus. (a) Representative female (top) and male (bottom) adults that were exposed to low (left) and high (right) levels of nutrition during larval development, respectively. (b) Scaling relationships between body size (as an estimate of larval nutrition; x-axis) and abdominal width (as an estimate of abdominal epithelium size), tibia length (as an estimate of leg size) and thoracic horn and head horn length, respectively. All plots are on the same scale to highlight relative differences in growth responses across body regions. Measurements from males are shown as solid circles, those from females as open circles to highlight the relative magnitude of sexual dimorphism for each focal trait (indicated by arrows for leg, thoracic and head horns).
