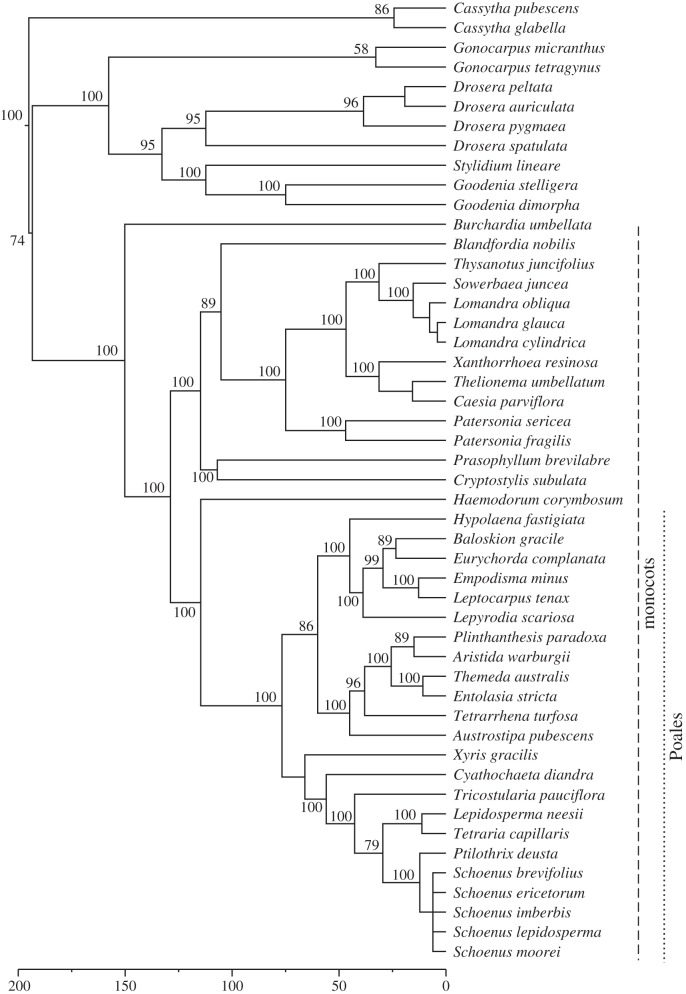
Figure 1.
Community phylogeny for all species recorded in plots across the full monitoring period. Vertical dashed/dotted lines denote species belonging to two nested taxonomic groups (monocots and Poales) on which separate analyses were performed. Node labels denote posterior support values, with unlabelled nodes indicating points where taxa were manually added to the phylogeny post processing. Timescale is in millions of years before present.

