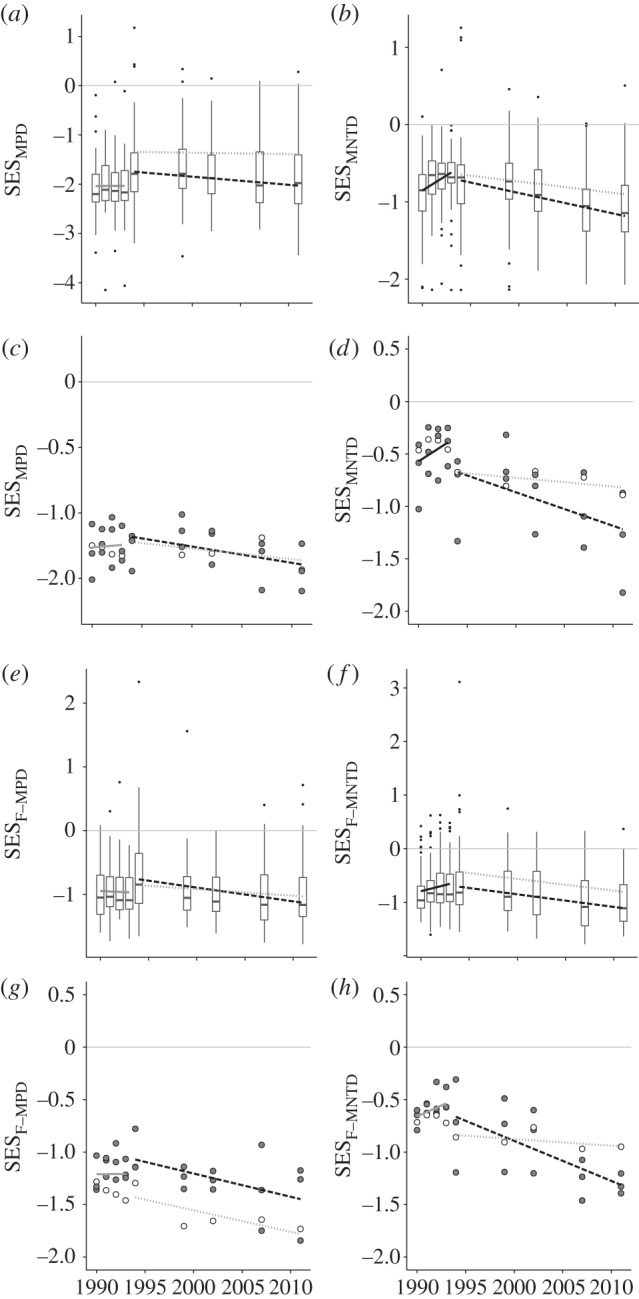
Figure 2.

Phylogenetic and functional community structure through time based on the standardized effect size of: mean pairwise phylogenetic distance (MPD) between all species in each (a) plot and (c) site; mean phylogenetic distance between nearest taxonomic neighbours (MNTD) in each (b) plot and (d) site; mean pairwise functional distance (F-MPD) between all species in each (e) plot and (g) site; mean functional distance between nearest taxonomic neighbours (F-MNTD) in each (f) plot and (h) site. Trendlines correspond to models of MNTD/MPD versus time for all plots/sites through the first 4 years of sampling (solid line); plots/sites that only burnt in 1994 (dashed line) and plots that burnt in 1994 and 2001 (dotted lines). Trend lines shaded black indicate significant slope coefficients at p < 0.05; grey lines indicate insignificant slopes. In (a,b,e,f), boxplot midline corresponds to median value for all 56 plots at each census point; upper and lower hinges give the first and third quartiles; whiskers extend from the hinge to the highest value that is within 1.5× interquartile range; and data points beyond whiskers are shown as outliers. In (c,d,g,h), open circles correspond to sites that burnt in the 2001 fire; grey-filled circles correspond with sites that did not burn in 2001.
