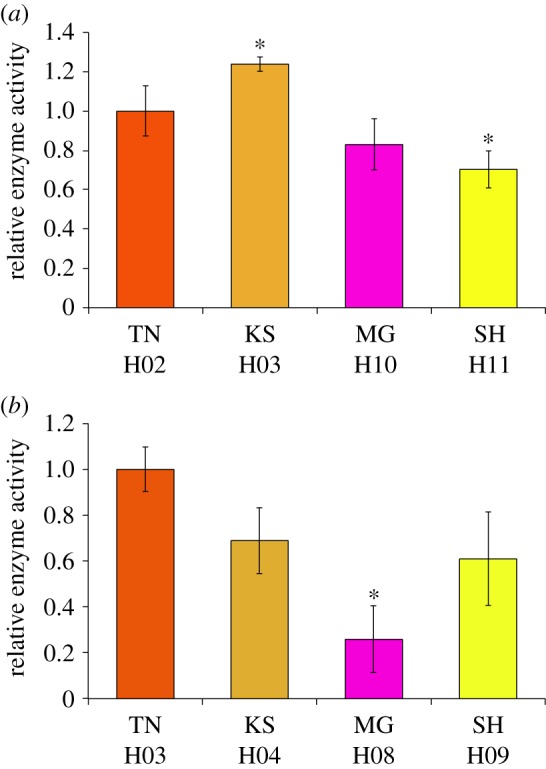
Figure 2.

Relative enzyme activities of medaka CYP1A and CYP1B1. The x-axis displays the names of local wild medaka populations and corresponding CYP1A (a) and CYP1B1 (b) haplotypes. Each bar represents the mean ± s.d. from multiple independent samples. Each colour corresponds with that in the electronic supplementary material, figure S2a,b. Significant differences against Tanabe alleles were identified using Games–Howell tests; *p < 0.05.
