
Figure 2.
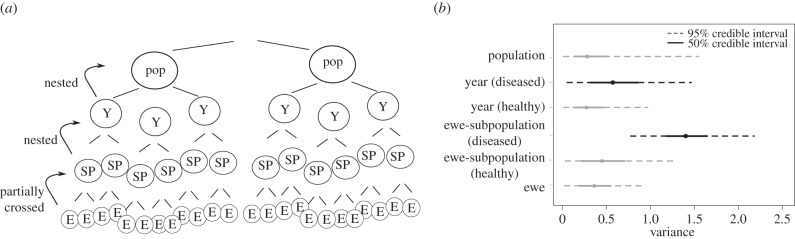
(a) Schematic of hierarchical structure of variance decomposition. Y, ‘year’, SP, ‘subpopulation’, E, ‘ewe’. (b) Variance attributed to each random effect (ewe-subpopulations, years, specific ewes). Grey lines indicate 95% posterior credible intervals associated with each variance component. Black is used for variance decomposition when disease is present; grey is used in years when no disease was detected. Variance decompositions are based only on years with multiple components. Ewe and population effects were estimated across all years (healthy and diseased), and are thus shown as a single distribution applied across all disease classes. Variance in the hierarchical (ewe, subpopulation, year, population) logistic regression model in diseased cohorts was estimated to be 1.41 at the subpopulation level (95% credible interval from 0.77 to 2.21), and 0.58 at the year level (95% credible interval from 0.03 to 1.45). In healthy years, variance based on 167 lambs was estimated as 0.43 at the subpopulation level (95% credible interval from 0.02 to 1.32), and 0.279 (95% credible interval from 0.01 to 0.96) at the year level. Variance attributable to ewe effects across all years was estimated at 0.406 (95% credible interval from 0.02 to 0.95); variance attributable to population was estimated at 0.280 (95% credible interval from 0.01 to 1.46).