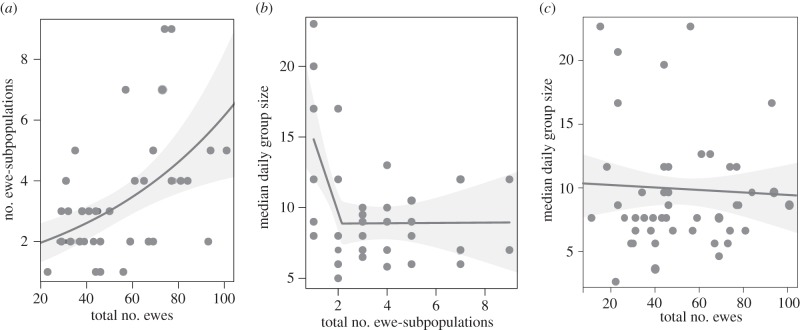
Figure 3.
(a) Number of ewe-subpopulations by estimated number of ewes in the population. Grey shading indicates the 95% confidence regions associated with the fit from a Poisson mixed effects model describing number of components as a function of total number of ewes with random slopes and intercepts for each population. (b) Median observed group size by number of ewe-subpopulations. Grey shading indicates 95% confidence regions for the structure of the piecewise linear relationship. (c) Median daily observed group size by estimated number of ewes in the population for all population-years included in this study. Grey shading indicates 95% confidence regions estimated from a Poisson mixed effects model relating total number of ewes in a given population-year to daily observed ewe group sizes.

