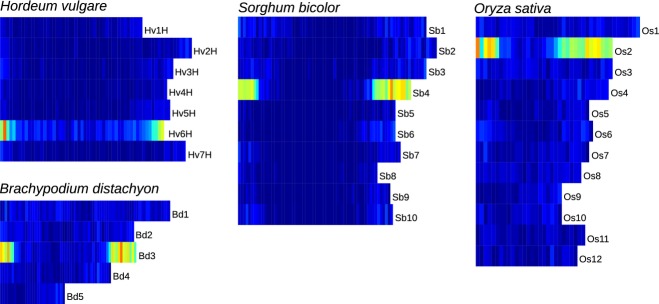
Figure 7.

Wheat chromosome 6A physical map-associated genes mapped to barley (Hordeum vulgare; Hv), Brachypodium distachyon (Bd), rice (Oryza sativa; Os) and Sorghum bicolor (Sb) genomes. In barley, only genetically anchored genes are depicted (IBSC, 2012). Gene overlaps ranged from 0 (dark blue) to the maximum, shown in dark red.
