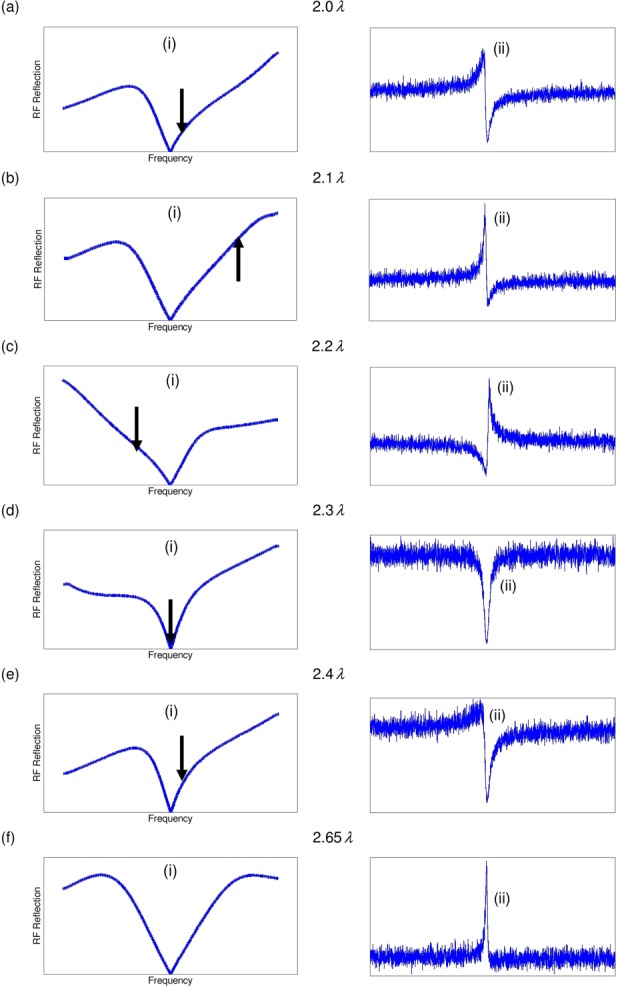
Figure 2.

Comparison of tuning curves and spin-noise signals at 500 MHz using the indicated coaxial cable lengths between the preamplifier and the probe. (i) Tuning curves tuned and matched to the CTO at 500.202 MHz. The arrows indicate the SNTO position. (ii) Corresponding spin-noise signals at CTO. (a) 2.0λ cable length, SNTO at 500.907 MHz (+705 kHz shift from CTO), (b) 2.1λ cable length, SNTO at 502.400 MHz (+2198 kHz shift from CTO), (c) 2.2λ cable length, SNTO at 498.837 MHz (−1365 kHz shift from CTO), (d) 2.3λ cable length, SNTO at 500.202 MHz (0 kHz shift from CTO), (e) 2.4λ cable length, SNTO at 500.594 MHz (+392 kHz shift from CTO), (f) 2.65λ cable length, no SNTO found.
