
Figure 3.
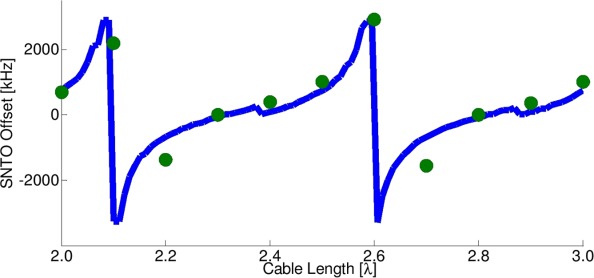
SNTO offset from CTO as a function of coaxial cable length in units of wavelength. Green circles: Measured values, where the SNTO positions were found by determining the tuning frequency that gave a symmetrical dip of the water proton spin-noise signal. Blue line: Simulated curve, values of L = 40 nH, Q = 400 were used in the simulation. Additional simulation parameters are described in the text.