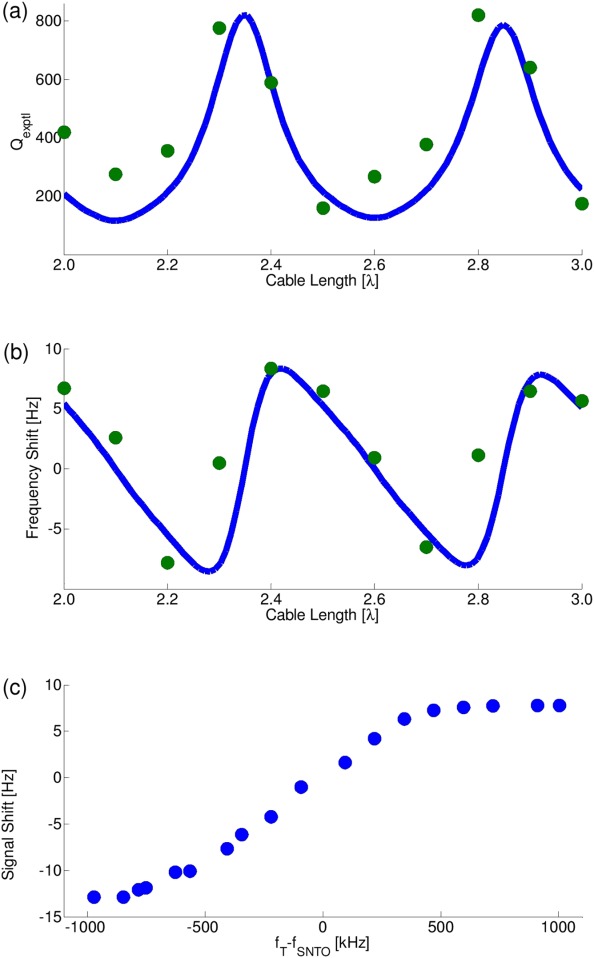
Figure 4.

(a) Qexptl as a function of cable length in units of wavelength. Green circles: Measured Qexptl. Qexptl was calculated using the tuning frequency (all were done at CTO frequency), divided by the width of the tuning curve at half height from the baseline. Blue line: Simulated Qexptl. (b) Resonance frequency shift at CTO as a function of coaxial cable length in units of wavelength. Green circles: Measured values. Blue line: Simulation. (c) Frequency shifts of water proton noise signals using a 2.0λ coax cable length. The frequency shift is plotted as a function of tuning offset fT − fSNTO for values in the range of −1,000 kHz < fT − fSNTO < 1,000 kHz.
