
Figure 5.
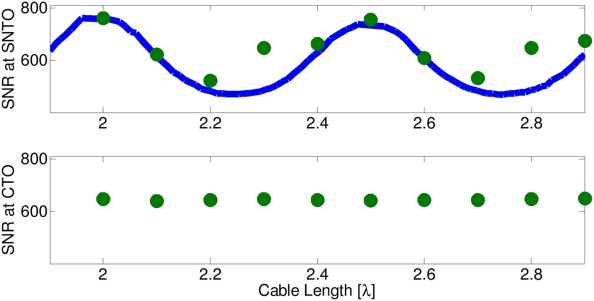
SNR values as a function of cable length in units of wavelength. Green circles: Measured SNR values at (a) SNTO and (b) CTO. Blue line: Simulated SNR values (for SNTO tuning plot in (a) only). The simulated plot is shifted by −0.1λ to obtain the best fit as described in the text.