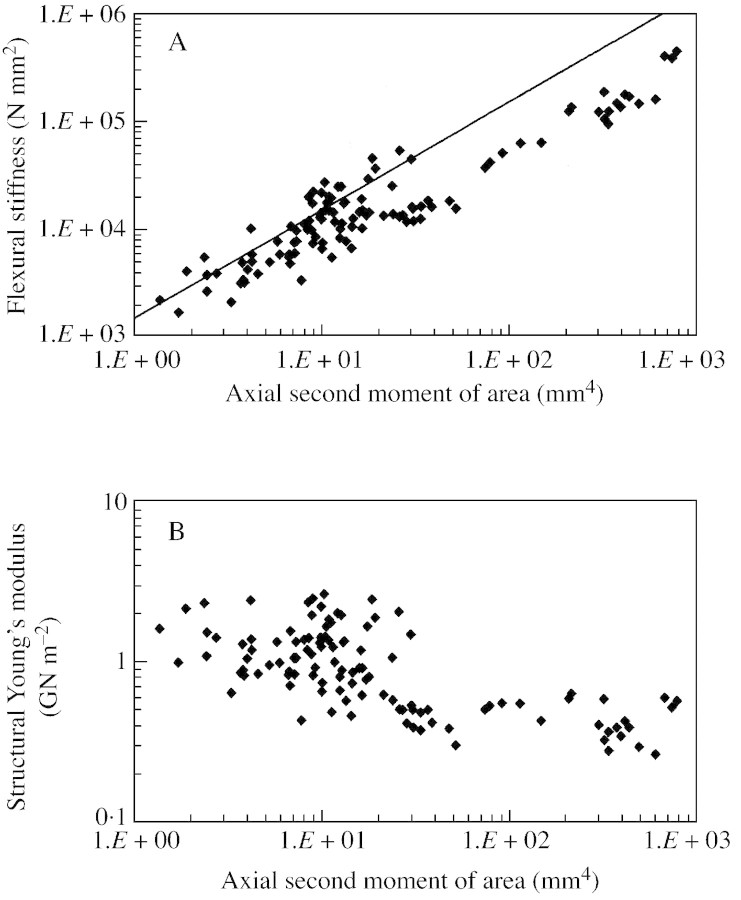
Fig. 4. Biomechanical results of entire data set including unbiased samples from over 13 plant stems. The entire data set includes all types of axes of all stages of growth and ontogeny. A, Double logarithmic plot of flexural stiffness (EI) against axial second moment of area (I) (see text for explanation of neutral line). B, Double logarithmic plot of structural Young’s modulus (Estr) against axial second moment of area (I).

An official website of the United States government
Here's how you know
Official websites use .gov
A
.gov website belongs to an official
government organization in the United States.
Secure .gov websites use HTTPS
A lock (
) or https:// means you've safely
connected to the .gov website. Share sensitive
information only on official, secure websites.
