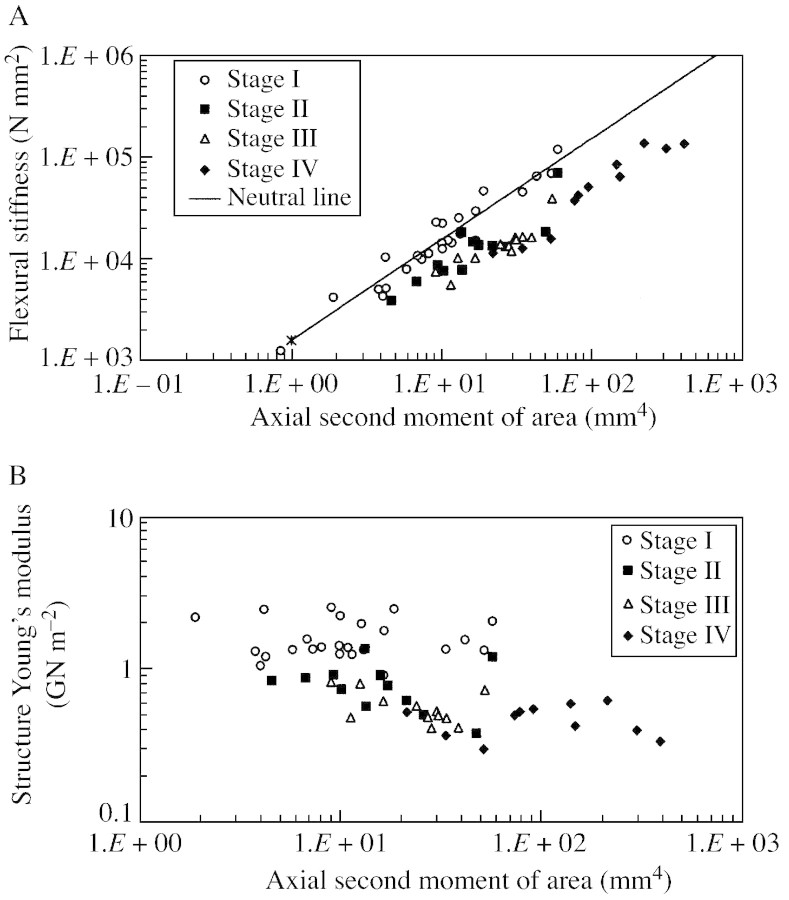
Fig. 5. Biomechanical results of different ontogenetic stages (see Fig. 2B), based on representative stages of growth from individuals in the total data set (Fig. 4). A, Double logarithmic plot of flexural stiffness (EI) against axial second moment of area (I). B, Double logarithmic plot of structural Young’s modulus (Estr) against axial second moment of area (I).

An official website of the United States government
Here's how you know
Official websites use .gov
A
.gov website belongs to an official
government organization in the United States.
Secure .gov websites use HTTPS
A lock (
) or https:// means you've safely
connected to the .gov website. Share sensitive
information only on official, secure websites.
