
Figure 1.
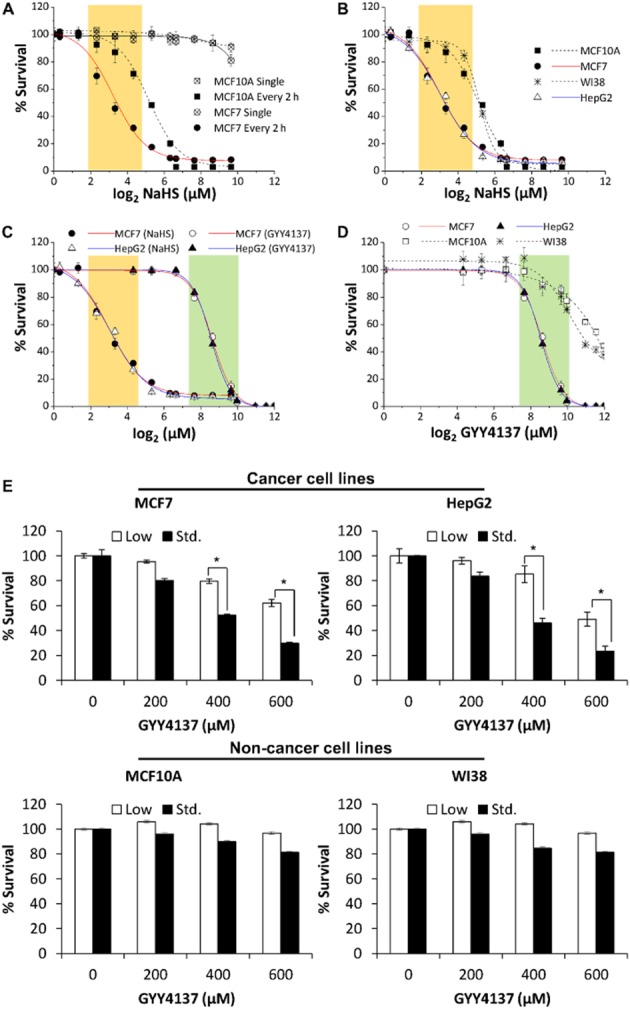
H2S effect on survival of cancer and non-cancer cell lines. (A) Continuous but not single exposure to NaHS decreased cell survival and the effects were stronger in the MCF7 cancer cell as compared to MCF10A non-cancer cell line. The effective concentration window for selective anti-cancer survival (i.e. non-cancer cell ≥75% cell survival) was shaded in orange (log2 2.32, 3.32, 4.32; corresponding to 5, 10 and 20 μM NaHS). (B) An additional cancer cell line HepG2 and non-cancer cell line WI38 showed similar concentration-responses to NaHS as that of MCF7 and MCF10A. (C) Comparison of effective concentration windows of NaHS and the slow H2S-releasing donor GYY4137 in MCF7 and HepG2. GYY4137 showed a right shift in its effective concentration window as compared to NaHS (region shaded green as compared to orange). (D) GYY4137 exhibited high selectivity on cancer cell lines within its effective concentration window (log2 7.64, 8.64, 9.64; corresponding to 200, 400 and 800 μM GYY4137). (E) Anti-survival effect of H2S was more prominent when cancer cells were cultured under standard glucose DMEM (Std., 25 mM) as compared to low glucose DMEM (5 mM). Minimal effect of GYY4137 (200–600 μM) was detected in non-cancer cells MCF10A and WI38 (bottom panel) as compared to cancer cells. (n = 3), *P < 0.05. Results are mean ± SD.