
Figure 5.
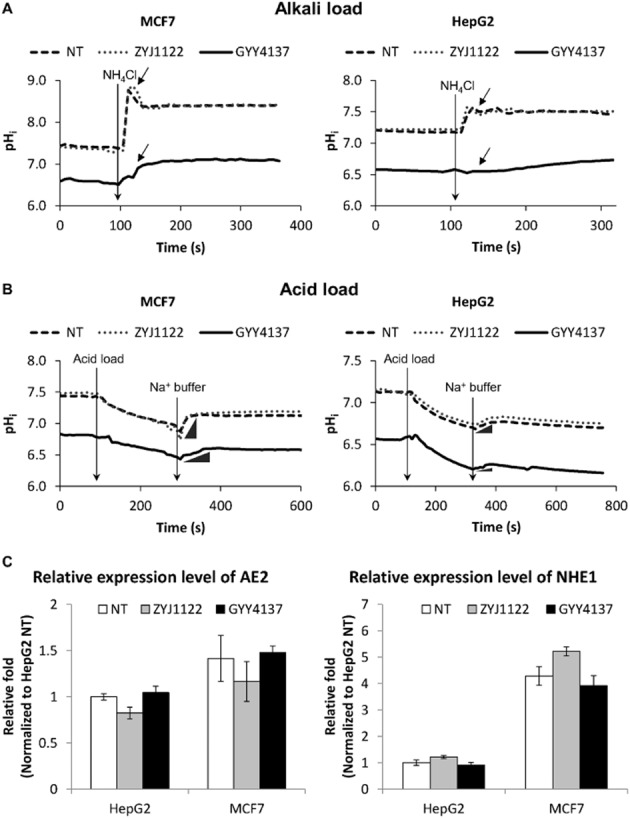
Reduced pH response capacity in cancer cells upon H2S exposure. (A) Alkali response and (B) acid response curves of MCF7 and HepG2. GYY4137-treated cancer cells showed reduced responses of the signature alkali peak (indicated by arrow) as observed in NT and ZYJ1122 negative control. GYY4137-treated samples showed slow and minimal recovery of pHi (indicated by the inset  ) upon re-introduction of sodium (Na+) buffer as compared to NT and ZYJ1122-treated cells. (C) H2S treatment did not affect the expression levels of pH regulators. No significant differences in transcript level of AE2 and NHE1 pH regulators in HepG2 and MCF7 upon exposure of H2S. NT, non-treated. ZYJ1122 and GYY4137, 400 μM (n = 3). Results are mean ± SD.