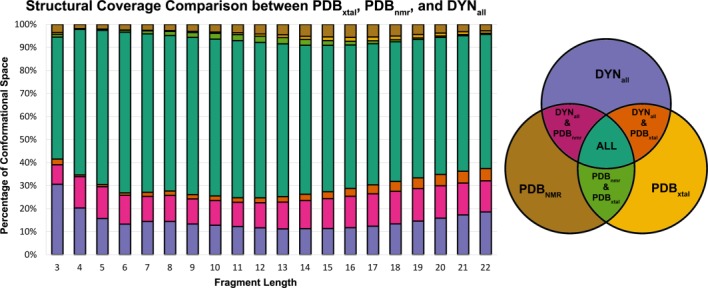
Figure 2.

Comparison of structural coverage between fragments generated from crystal structures, NMR structures, and Dynameomics structures. We show the DYNall library here because fragments from both native-state and unfolding simulations provide informative conformations for loop predictions. The colors in the chart correspond to the Venn diagram on the right. The magenta area corresponds to the percentage of histogram bins that are shared between the PDBnmr and DYNall fragment libraries, but do not contain representatives from the PDBxtal fragment library.
