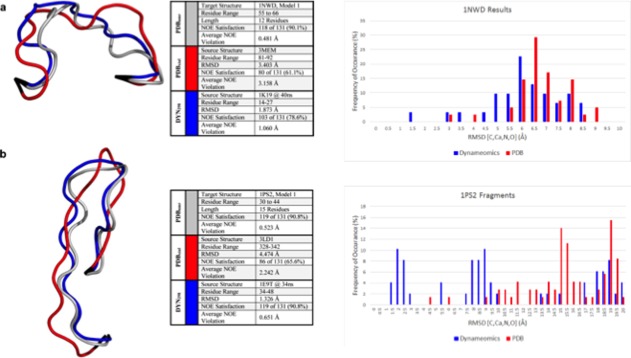
Figure 4.

Predictions of loops in NMR structures. The NMR structures are depicted in grey, the crystal predictions in red, the Dynameomics predictions in blue, and anchor residues in black. RMSD and NOE results do not include anchor residues in the calculations. The best prediction in each case is displayed and information regarding the source and statistics are given in the table. In addition, histograms showing the distributions of the predictions with respect to how well they model the experimental loop conformation are provided for both proteins and the best predictions come from the Dynameomics dataset. (a) A 12 residue structure in 1NWD, not including anchor residues. (b) A 15 residue loop structure in 1PS2, not including anchor residues.
