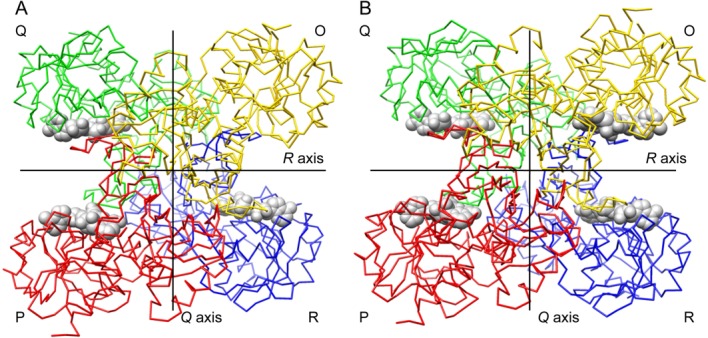
Figure 2.

Carbon trace representations of bovine GAPDH tetramer structures. A. Structural model of bGAPDH(NAD)3. The NAD-free subunit named as “O” is shown in yellow. B. Structural model of bGAPDH(NAD)4. This view is down the P axis. Lines show the location of the Q and R twofold molecular axes. NAD cofactors are displayed in spheres. Subunit nomenclature and coloring is as described in Ref. (26). An interactive view is available in the electronic version of the article.
