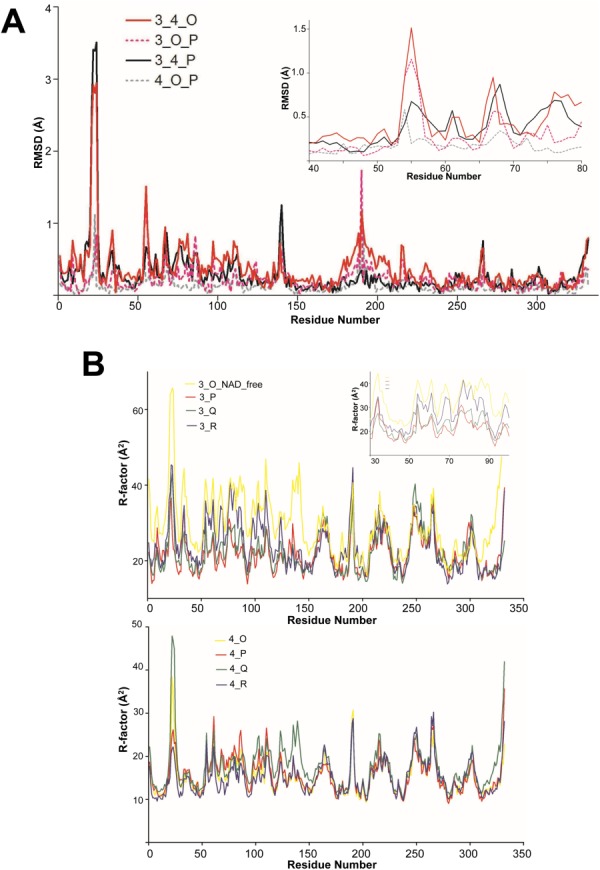
Figure 4.

Structural comparison of the NAD-free and NAD-bound subunits. (A). The RMSD of Cα atoms in paired residues from apo- and holo-subunits of bGAPDH. The subunit of O (NAD-free) from bGAPDH(NAD)3 and subunit O (NAD-bound) from bGAPDH(NAD)4 were superimposed (solid red line, labeled as 3_4_O). Subunits of O (NAD-free) and P (NAD-bound) from bGAPDH(NAD)3 were superimposed (dotted red line, labeled as 3_O_P). Subunits of P from bGAPDH(NAD)3 and bGAPDH(NAD)4 were superimposed as one control (solid black line, labeled as 3_4_P) and subunits of O and P from fully bGAPDH(NAD)4 were superimposed as another control (dotted gray line, labeled as 4_O_P). Insert shows the plotted region comprised residues 40–80. B. Comparison of B-factors of residues in the main chains of apo- and holo-subunits of bGAPDH. The averaged B-factor values of the residue from main chain atoms from the four subunits of bGAPDH(NAD)3 were plotted along with the residue number (upper panel, solid lines, labeled as 3_O (NAD_free), 3_P, 3_Q, and 3_R). Insert shows the plot region from residues 30 to 100. The averaged B-factor values of the residue from main chain atoms from the four subunits of bGAPDH(NAD)4 were plotted along with the residue number (lower panel, solid lines, labeled as 4_O, 4_P, 4_Q, and 4_R). Each subunit was presented as a solid line colored as in Figure 2.
