Figure 6.

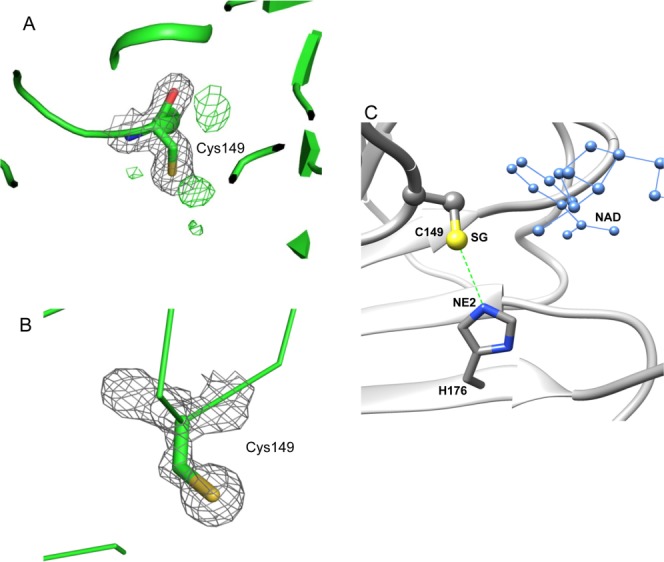
The active site Cys149 in bGAPDH and its interaction with His176. A. Electron density of Cys149 in subunit R of bGAPDH(NAD)3. The 2Fo–Fc electron density map is presented as grey meshes contoured at 1.0σ. The green meshes represent a Fo–Fc electron density map contoured at 3.0σ. The presence of a positive density next to the SG atom of Cys149 strongly suggests an oxidative state for this residue. B. Electron density of Cys149 in subunit R of bGAPDH (NAD)4. None of the four subunits exhibited a positive density next to the SG atom of Cys149 in the Fo–Fc map. Figures were prepared with PyMol software. C. Interaction between Cys149 and His176 in subunits of bGAPDH. The distance between the SG group (shown in yellow) of Cys149 and the NE2 group (shown in blue) of His176 is indicated by a dotted green line. The adjacent NAD molecule is shown in blue ball-and-sticks.
