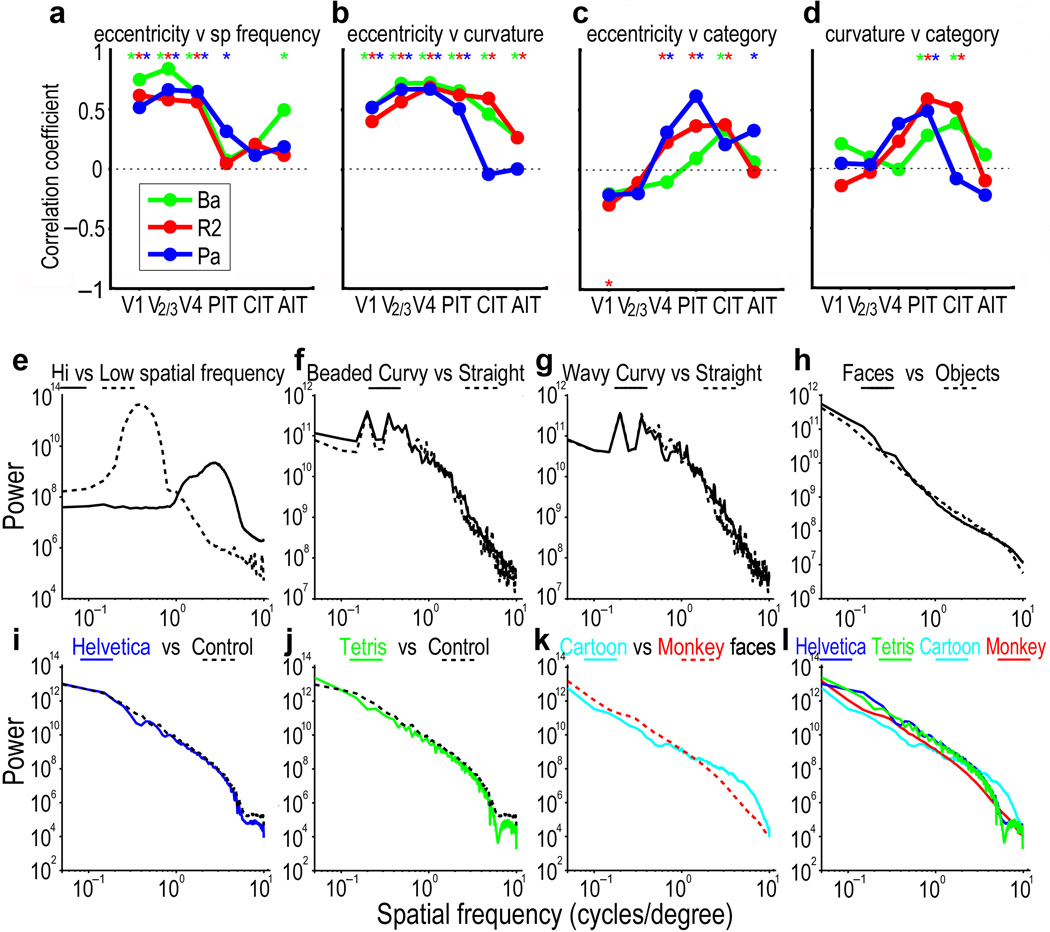
Fig. 5.
Relationship between eccentricity, spatial frequency, curvature and category. (a–d) Voxel-wise correlations between pairs of contrast maps for visual areas V1, V2&V3, V4, PIT, CIT, and AIT from 3 monkeys (Ba, R2, & Pa); the correlations are calculated between the contrast maps in Fig. 4, with the addition of a map for low-spatial frequency minus high-spatial frequency patterns for the same 3 monkeys (stimuli shown in Fig. S2; maps for spatial frequency in Fig. S11). Dotted line indicates zero correlation. Asterisks at the top indicate correlations that were significantly greater than zero at p<0.05; the asterisk at the bottom of the 3rd map indicates a correlation that was significantly less than zero at p<0.05. The contrast maps used for this analysis were Eccentricity: 4–10° patterns minus 0–3° patterns; Spatial Frequency: 0.4 cpd patterns minus 2.5 cpd patterns; Curvature: straight minus curvy patterns; Category: objects minus faces. (e–l) Spatial frequency power spectra, averaged over each stimulus set, as indicated.

