
Figure 2. Altered expression of genes involved in fatty acid catabolic pathways in HF.
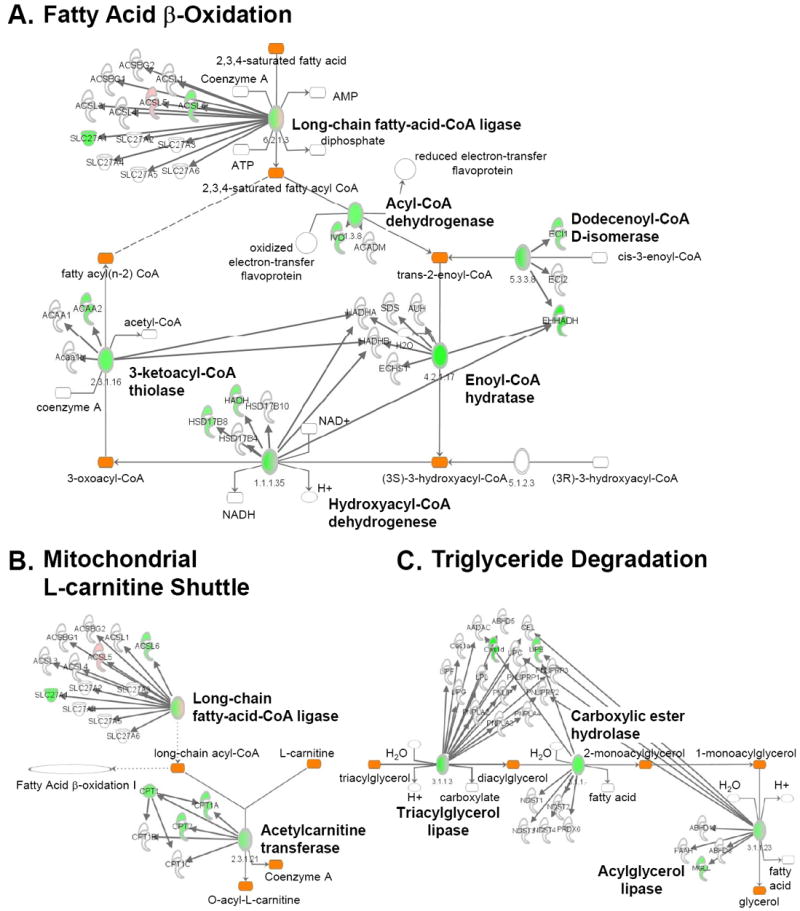
Pathway map showing cardiac genes significantly (DE ≥ 0.950) upregulated (pink) or downregulated (green) compared to controls. Pathways involved in lipid utilization are shown including FAO (A), mitochondrial L-carnitine shuttle (B), and triglyceride degradation (C) as identified by IPA (see Supplemental Methods). The ovals in the map represent enzyme complexes with components of each gene/enzyme displayed individually as denoted by the arrows. The intensity of the color within the symbols and ovals denotes the degree of regulation.