
Figure 6. Reduced expression of genes involved in fatty acid uptake and oxidation in HF.
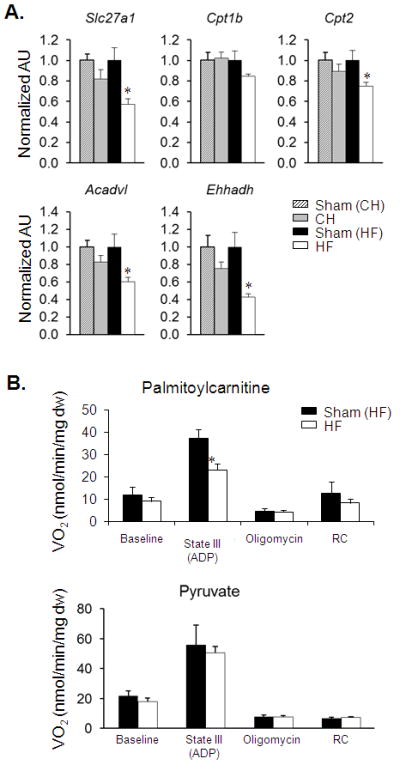
(A) Results of quantitative RT-PCR analysis of RNA extracted from hearts of CH (n=7), HF (n=7) and corresponding sham-operated controls (n=5-7) for the transcripts as labeled. Bars represent mean ± S.E. normalized (=1.0) to each sham control. *p < 0.05 compared to corresponding sham-operated control. (B) Mean (± S.E.) mitochondrial respiration rates of permeabilized cardiac muscle fiber strips prepared from HF mice (n=11) and sham-operated controls (n=5-8) using palmitoylcarnitine/malate (top) or pyruvate/malate (bottom) as substrate. Basal, state III (ADP-stimulated), and post-oligomycinrates are shown. Respiratory control ratio (RC) = state III/state IV. *p < 0.05 compared to Sham (HF).