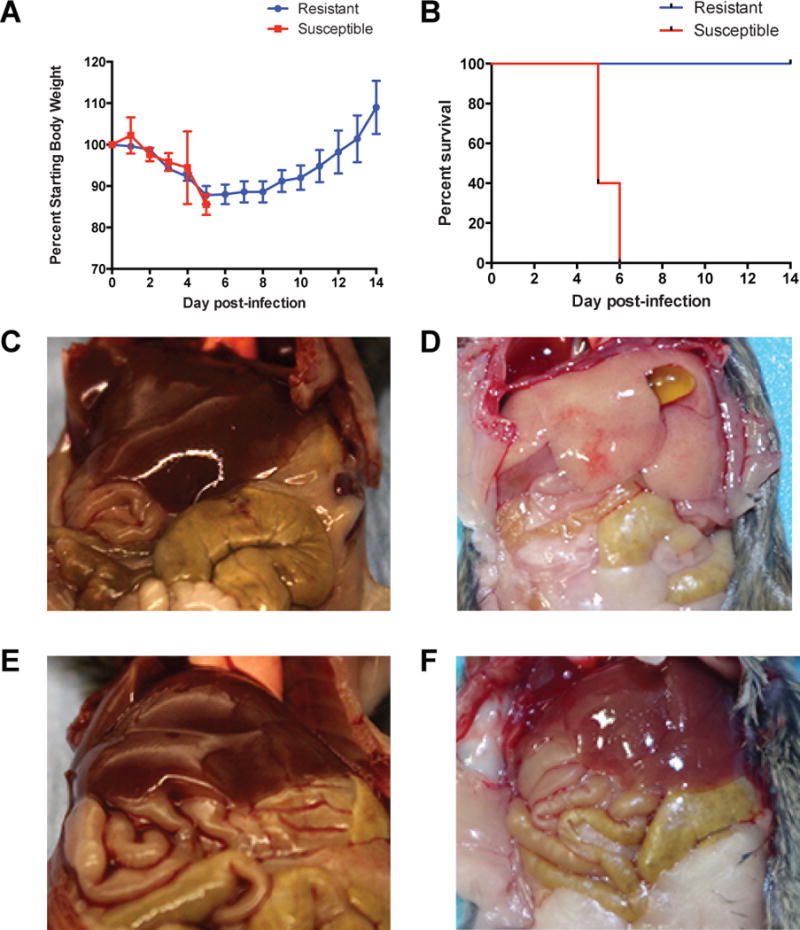
Figure 1. Distinct Morbidity and Mortality Following MA-EBOV Infection in CC-RIX Mouse Lines.

A. Percent of starting body weight over course of infection in susceptible (red squares) and resistant mice (blue circles). Data shown are mean ± SEM from five mice per CC-RIX line. B. Kaplan-Meier survival curve for susceptible (red) and resistant (blue) mice. Five mice were used for each CC-RIX line. C,D,E,F. Gross appearance of liver at necropsy in uninfected susceptible (C) and resistant (E) mice, and on day 5 post-infection in susceptible (D) and resistant (F) mice.
