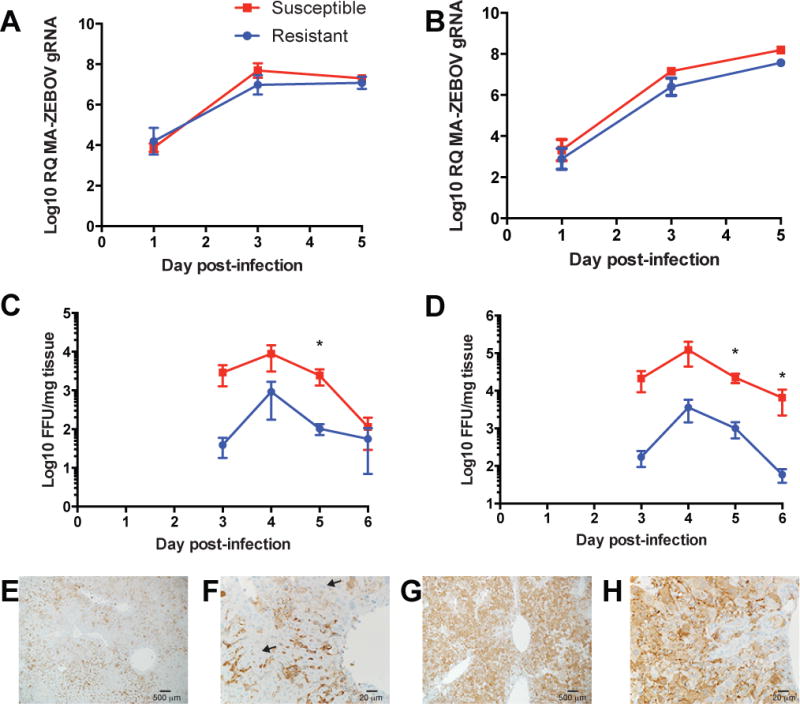
Figure 2. MA-EBOV Replication in CC-RIX Mouse Lines.

A,B. Quantitative real-time PCR showing expression of MA-EBOV genomes relative to mouse 18S rRNA in spleen (A) and liver (B). Data shown are mean ± SEM for three mice per time point per RIX line. C,D. Titration of infectious MA-EBOV in organ homogenates from spleen (C) and liver (D) quantified as focus forming units per milliliter. No infectious virus was detected prior to day 3 p.i. Data shown are mean ± SEM from two experiments using 2–3 mice per time point per CC-RIX line. E,F,G,H. Immunohistochemical staining for VP40 in resistant liver (E,F) and susceptible liver (G,H). Arrow indicates representative hepatocyte morphology. (t-test, *p<0.05)
