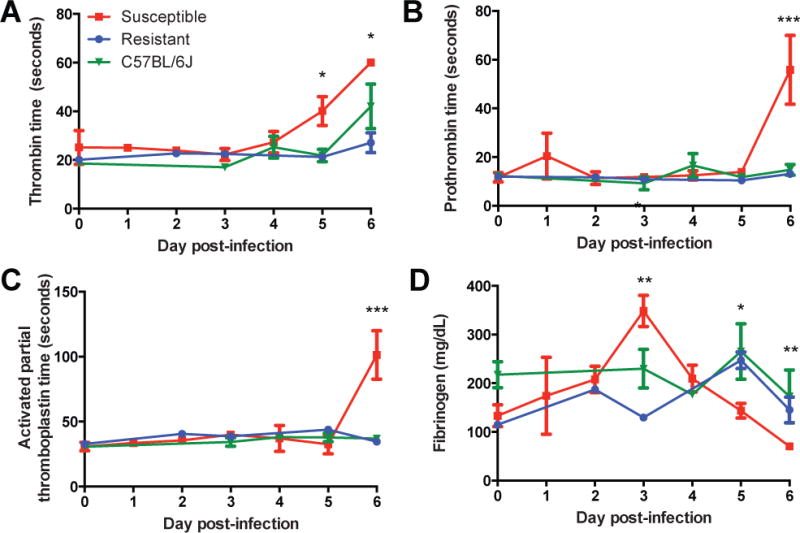
Figure 3. Quantification of Coagulopathy and Hemorrhage in CC-RIX Mouse Lines.

A,B,C. Coagulation times in seconds for thrombin (A), prothrombin (B), and activated partial thromboplastin (C) over course of MA-EBOV infection. D. Serum fibrinogen levels in CC-RIX mice over course of MA-EBOV infection. All data shown are the mean ± SEM for 2 experiments including 2–5 animals per time point. (ANOVA with Tukey’s HSD post-hoc. *p<0.05, **p<0.05, ***p<0.0000001).
