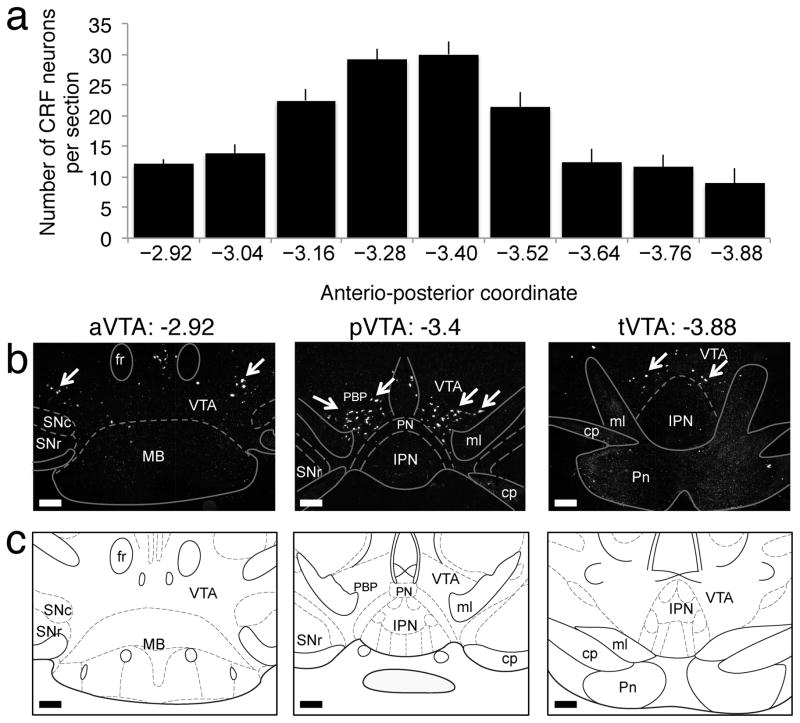
Fig. 2. Identification of VTA CRF neurons in mice.
a, Number of CRF neurons per section in the VTA (bregma range: −2.92 to −3.88) in mice (n = 24). Data represent mean ± SEM. b, Representative CRF mRNA in situ hybridization sections of the anterior (aVTA), posterior (pVTA), and tail (tVTA) of the VTA in naive mice. White arrows point to CRF neurons. c, Corresponding diagram from the Paxinos and Watson atlas. Scale bar = 200 μm

