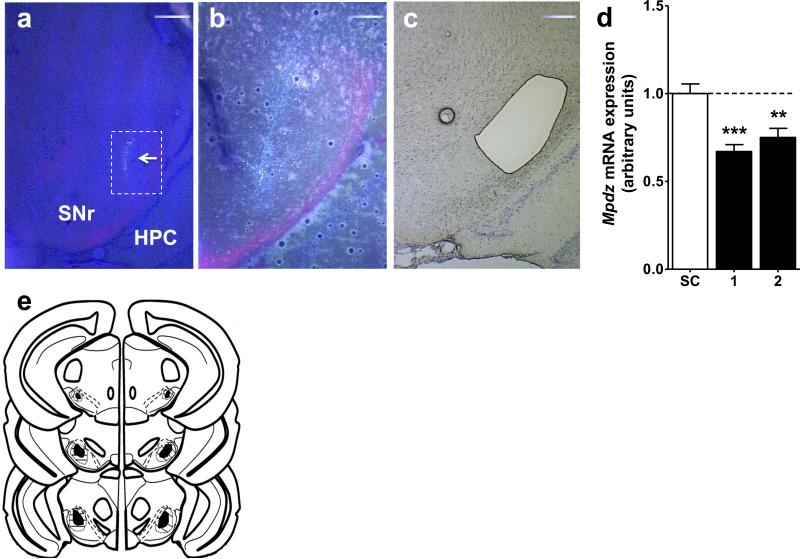
Figure 1. Bilateral Mpdz RNAi targeting of the clSNr.
Representative photomicrograph showing fluorescence at the microinjection site (arrow) overlain a light photomicrograph to visualize structure and GFP expression at (a) 4X and (b) 10X (of the area outlined in white within panel a). (c) 4X Thionin stained light photomicrograph image with the clSNr dissected by LCMD. (d) Data presented are for animals with confirmed bilateral targeting of the clSNr. Mpdz expression in LCMD clSNr from Mpdz shRNA animals in two experiments conducted 4 months apart (black bars) compared to scrambled control (SC) animals (open bar). (e) Schematic diagram of a coronal brain section depicting microinjection sites and extent of GFP expression (indicating viral infection) in the clSNr. The darkened regions indicate the sites of clSNr microinjections from all confirmed bilateral hits, identified by GFP. The striped region indicates the extent of GFP spread (including injection sites). Based on coordinates from the mouse brain atlas (Paxinos & Franklin, 2001), the confirmed microinjection sites and lentiviral spread ranged from −3.1 to −3.8 mm AP from Bregma in the clSNr. Additional abbreviations: HPC, hippocampus. Scale bars are located in the upper right hand corner of each panel. **p<0.01, ***p<0.001.

