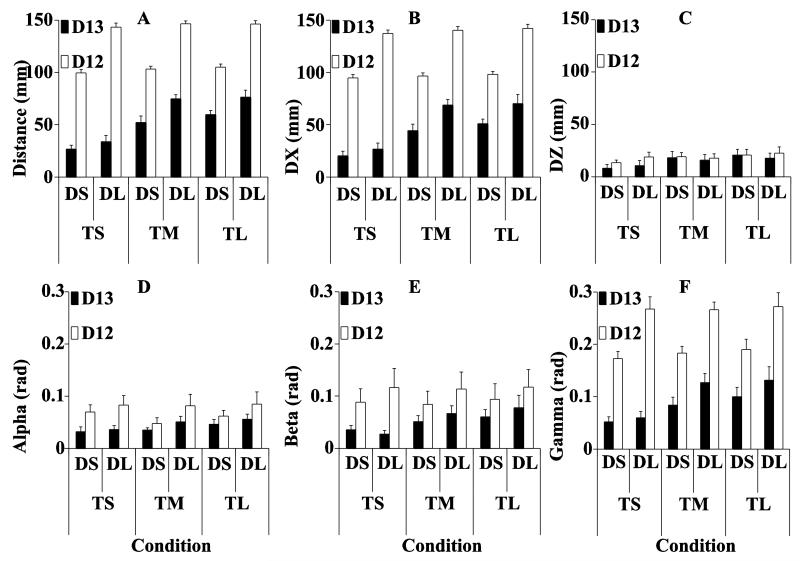
Figure 3.
The top left panel (A) shows the Euclidean distance for D12 and D13. The top middle (B) and right (C) panels show the distance for D12 and D13 along the X and Z directions separately. The bottom panels (D - F) show the absolute angle difference for D12 and for D13. Note that D12 > D13 in all conditions and for all variables. DS and DL indicate short and long perturbation distance, respectively. TS, TM and TL indicate short, medium and long dwell time, respectively. Averages across subjects are presented with standard error bars.

