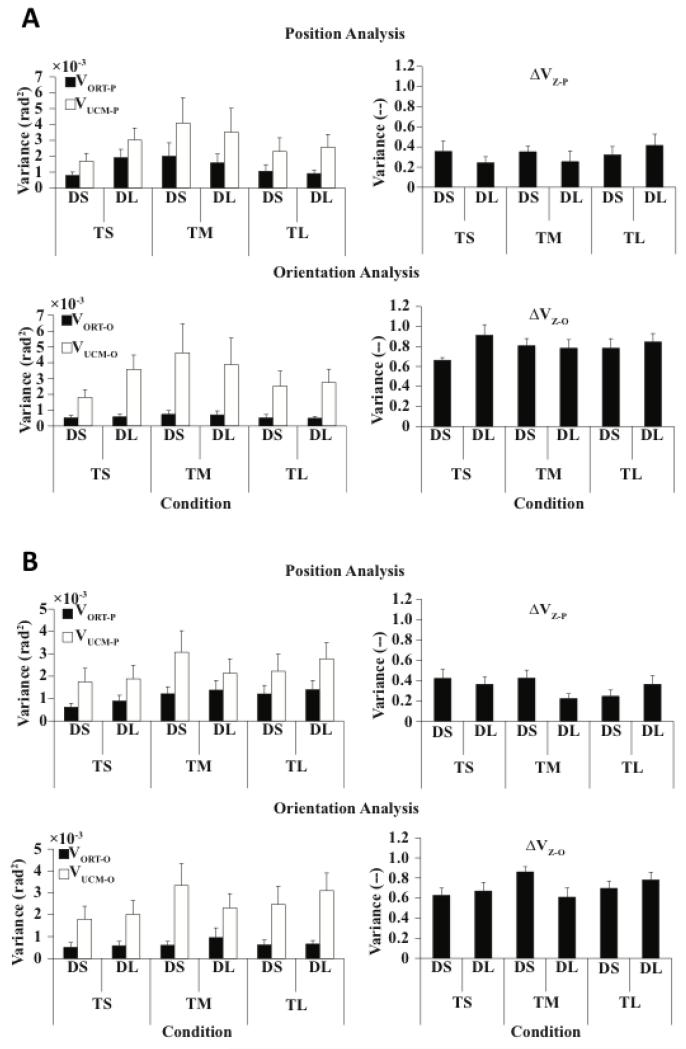
Figure 5.
A: Indices of joint configuration variance for D12. Left panels: Variance within the UCM for position- and orientation-related analyses (VUCMP and VUCMO) and variance orthogonal to the UCM for position- and orientation-related analyses (VORTP and VORTO). Right panels: Z-transformed synergy indices for position- and orientation-related analyses (ΔVZP and ΔVZO). Averages across subjects with standard error bars are presented. Note that VUCM > VORT (ΔV > 0) across all conditions and variables. B: Indices of joint configuration variance for D13.

