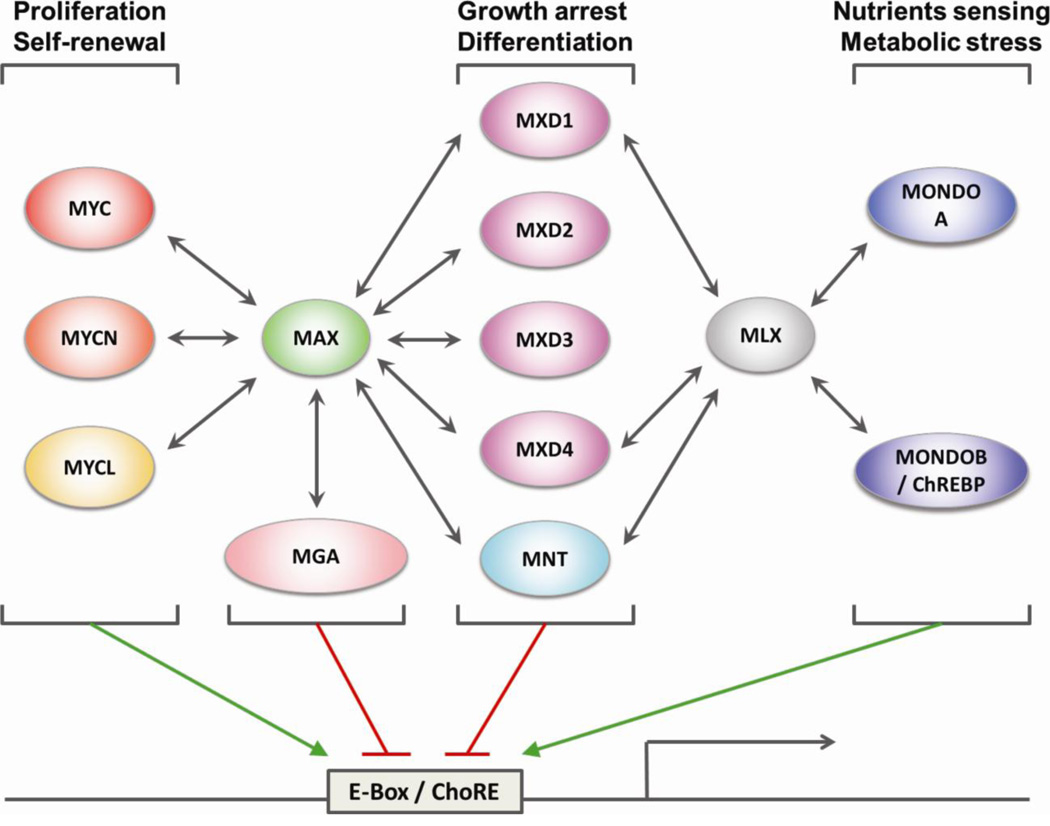
Figure 1. Diagram of the MAX/MLX network.
All members of the MAX/MLX network and their reciprocal heterodimerization partners (indicated by the two-headed arrows) are represented. Green arrows and red lines indicate transcriptional activation and repression respectively. E-Box, Enhancer-box; ChoRE, Carbohydrate response element.

