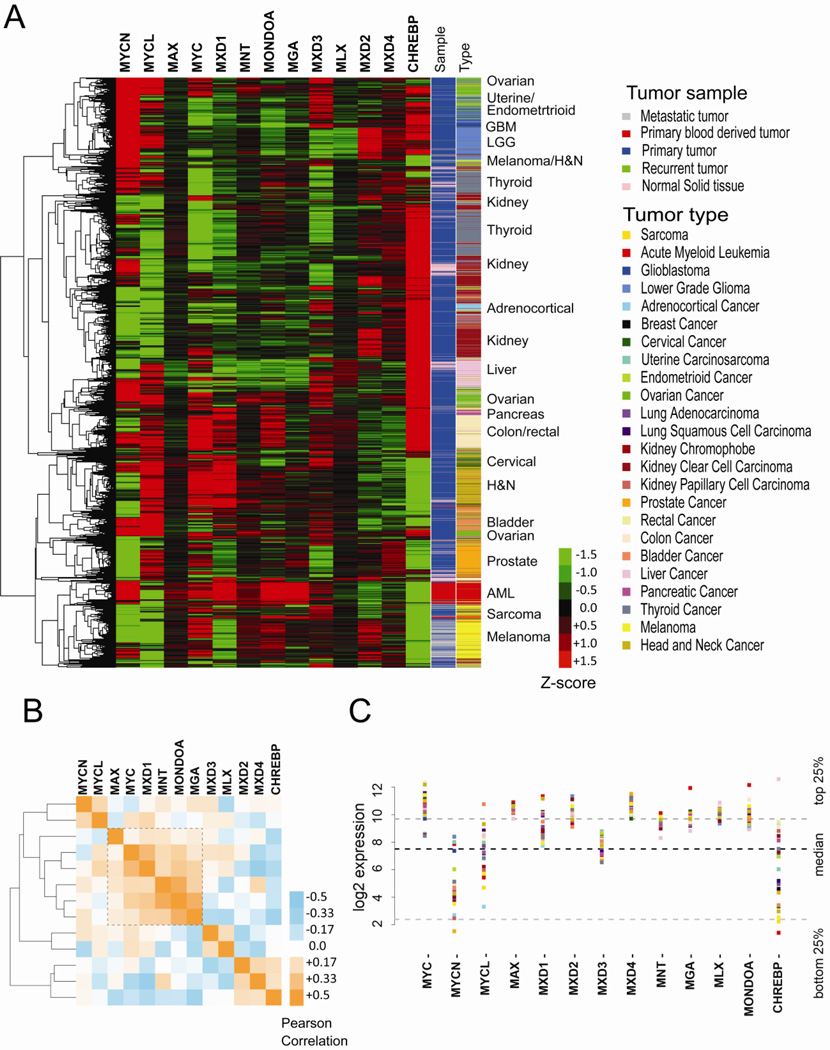
Figure 6. Analysis of the MAX/MLX network in human cancer.
A) Relative distribution of the network members across TCGA tissue types, each represented by a different color (“tumor type column”). “Sample” column: Pink normal tissue; Blue, Primary Tumor; Red, Acute Myeloid Leukemia; Grey, Metastatic tumor; Green Recurrent tumor. Due to the heterogeneity in expression, breast and lung samples have been excluded from this representation to more readily identify the distinct expression patterns of the other tumors. B) Pearson correlation of network member expression levels among all samples (including lung and breast). Orange: positive correlation, blue: negative correlation. C) Median of expression values within each tumor type (colored coded squares) are shown for each network member. Black dashed line, median expression of all genes across tumor types; Grey dashed lines, top and bottom 25% of genes.

