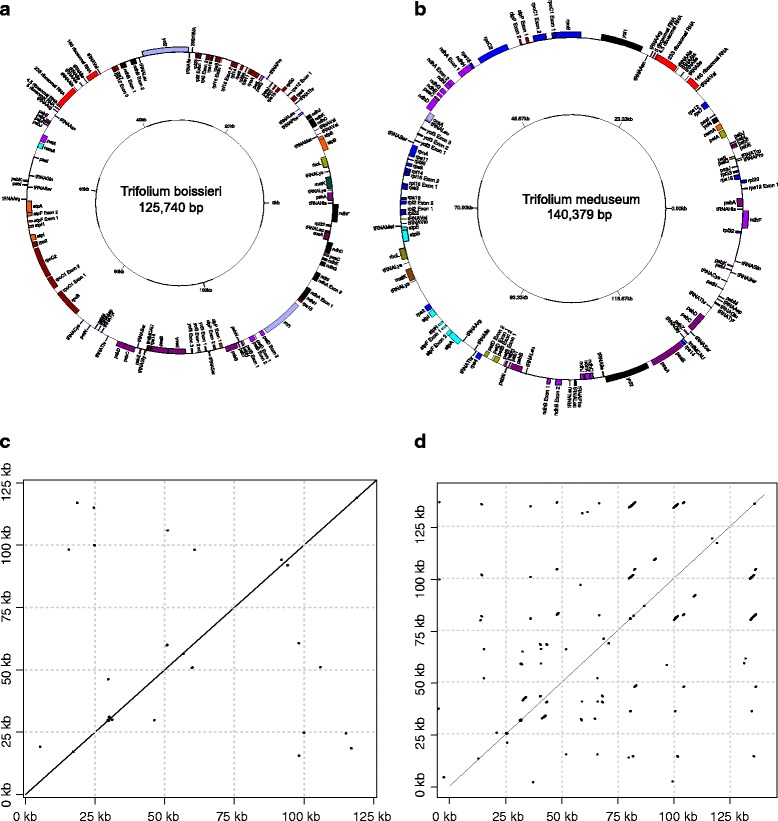
Figure 1.

Gene map of two Trifolium plastid genomes and dotplots illustrating repeated regions. Gene maps (a and b) and dotplots (c and d) of Trifolium boisseri (a and c) and Trifolium meduseum (b and d). The gene maps shows the postions and translation direction of protein coding genes, tRNAs and rRNAs in the plastid genome. The dotplots illustrate repeated sequences within the plastomes, identified by BLASTN, where aligned sequences are shown as lines. Since the plastomes are aligned to themselves, the entire plastome is represented as a long and uninterrupted diagonal line. Shorter lines and dots, that fall either above or below the long line are repeats.
