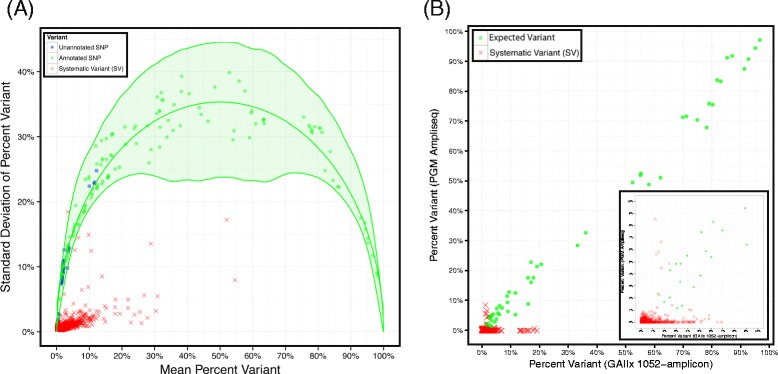
Figure 3.

Identification of systematic variants. A) The graph shows the behavior of genetic variants following a parabola (green line with a green ribbon for 99.8% CI based on 100,000 simulations) as motivated by Hardy-Weinberg equilibrium. The confidence intervals mostly capture known variants (green circles), but also some unannotated variants (blue circles). In stark contrast, potential variants identified as Systematic Variants (SVs, red Xs) behave differently as the standard deviation of the percent variant as a function of the mean violates Hardy-Weinberg equilibrium. B) A subset of SVs were confirmed on an independent sample set (reference DNA mixtures described in Figure 1), sequenced using an alternate NGS platform (Ion PGM, Life Technologies) and TAS panel (AmpliSeq Cancer Panel, Life Technologies). The points show the concordance of the known variants (green circles) on both platforms and SVs identified from 29 intact samples (red X’s). The SVs were predominately plotted along the x-axis (near y-intercept = 0) suggesting they are artifacts specific to the 1052-amplicon panel.
