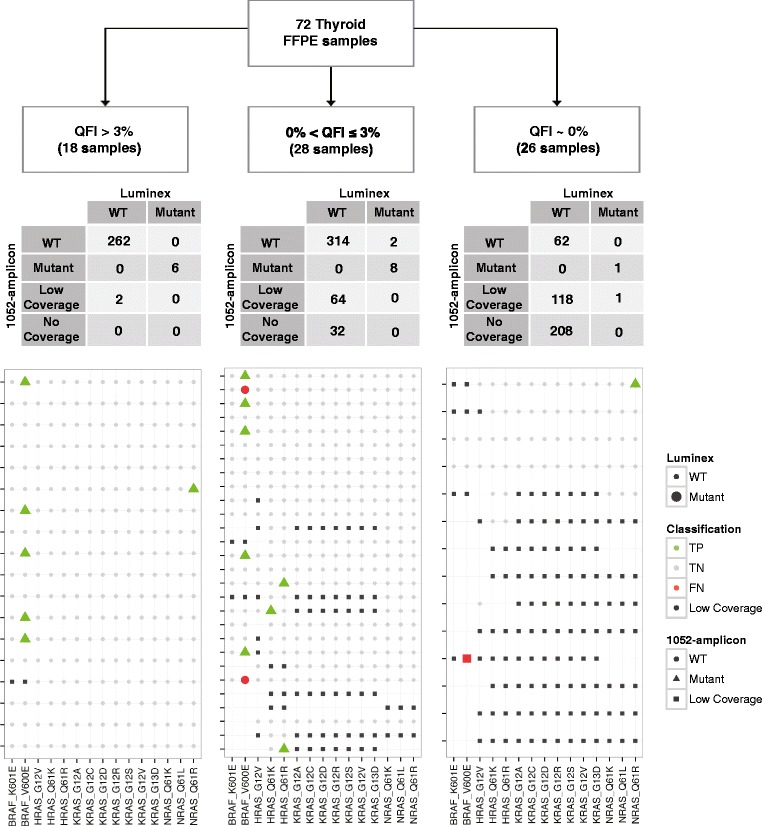
Figure 6.

Interplatform variant dection concordance stratified by QFI. DNA from 72 thyroid cancer FFPE samples was used to test the concordance of variant calling results between 1052-amplicon panel and a liquid bead array system (Luminex). The samples with the highest quality DNA (QFI >3%) showed the strongest concordance, >99% between the two variant detection platforms. The concordance rate decreases with reduced QFI. The size of the markers is based on Luminex status (large markers are mutants, small markers are wild type). The color of the markers is based on the classification status of the 1052-amplicon panel with data from the Luminex platform defined as truth: green is for true positives (TP); gray is for true negatives (TN); orange is for false positives (FP); red is for false negatives (FN); and black is for low sequencing coverage by the 1052-amplicon panel (Low Coverage). The specific predictions from the 1052-amplicon panel are defined as wild type (circles), mutant (triangle) and low coverage (square). The number of rows in the agreement maps corresponds to the number of samples in the study except when a sample had no coverage at any of the 15 specified hypotheses. For example, the left most panel has 18 rows corresponding to all 18 samples that were sequenced (with a total of 15 hypotheses *18 samples = 270 entries) so the 4x2 table above the agreement map sums to 270. However, the right most panel only has 14 rows representing 26 samples. That is, 12 samples had no coverage associated with the 15 hypotheses and are not shown, but the corresponding 4x2 table still sums to 15 hypotheses *26 samples = 390 entries. Incidentally, none of the samples that had zero coverage by the 1052-amplicon panel workflow had positive calls using the Luminex method.
