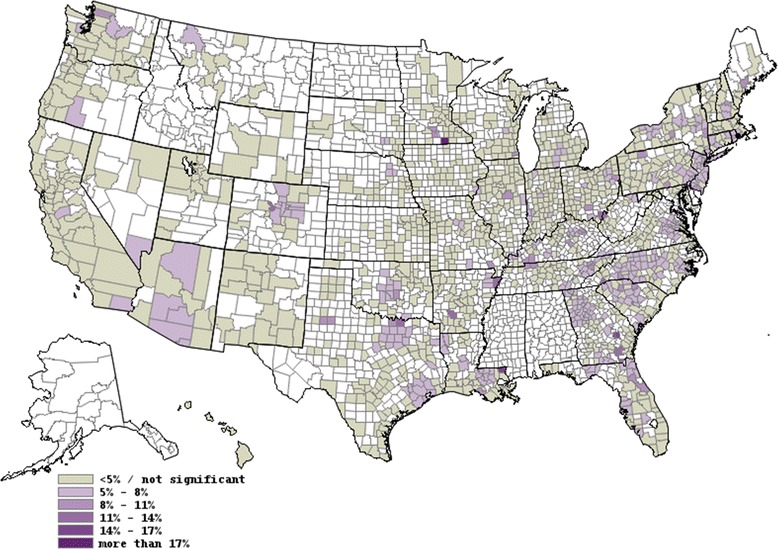
Figure 1.

Map displaying differences in private versus medicaid adjusted cesarean rates by core-based statistical area. Unshaded areas represent areas that are not included in the analysis because they are rural or in states where hospital data are not available. County boundaries are shown.
