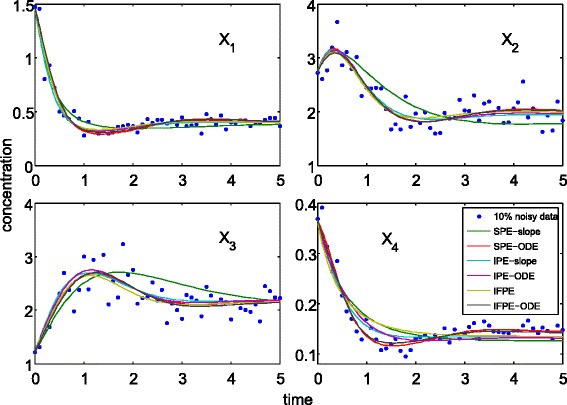
Figure 3.

Comparison of model predictions using the IPE, IFPE and SPE parameter estimates for the branched pathway case study. The noisy data correspond to one set of the five technical replicates. For the IPE and SPE-slope estimates, the results correspond to (s,o)=(5,3).
