
FIGURE 2.
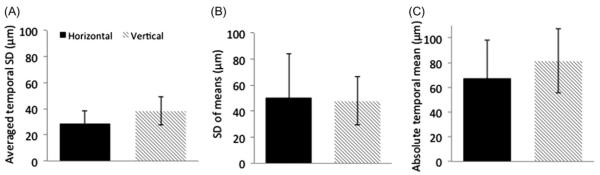
(A) Fluctuation within a single fixation sample was calculated by averaging the temporal standard deviations of every fixation period (10 per trial) yielding 29 ± 9 mm and 38 ± 11 μm for the horizontal and vertical displacements, respectively. (B) Fluctuation across multiple fixation samples was calculated by taking the temporal standard deviations across 10 fixation periods samples yielding 50 ± 34 μm and 48 ± 19 μm for the horizontal and vertical displacements, respectively. (C) The absolute mean difference of the eye position from a mean reference point was 67 ± 31 μm and 81 ± 26 μm for the horizontal and vertical displacements, respectively. Each trial consisted of 10 fixation samples and 2–3 trials were analyzed for each of the 5 subjects. Error bars are ±SD.