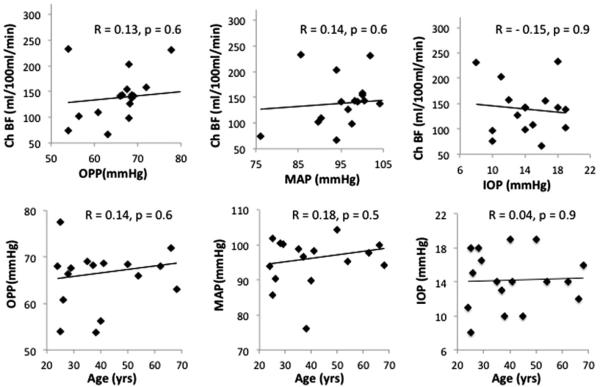
FIGURE 5.
Correlation plots of choroidal blood flow (ChBF) versus ocular perfusion pressure (OPP), mean arterial blood pressure (MAP), and intraocular pressure (IOP) for the ROI a (as shown in Figure 4). Correlation plots of OPP, MAP, and IOP versus age. Correlation plots show a trend but were not statistically significant (p>0.05).

